Showing posts with label Pasture growth rates. Show all posts

Friday, 29 July 2011

Fascinating New Pastures For Dairy Cows.....Thanks to Innovative Farmers

Many pasture based dairy farmers in both France & the UK are experimenting with mixed pasture swards. These “New Pastures” always include an abundance of clovers & increasingly include Herbs such as Chicory & Plantain. The inclusion of the deep rooting herbs adds a completely new dimension to pastures for grazing dairy cows.

These pastures are very different from conventional pastures in many ways. Nitrogen fed pastures tend to be monocultures of ryegrasses. Well managed ryegrass clover pastures are highly productive. The clover content is related to the grazing intensity & the amount of nitrogen used. The mixed pastures offer considerable biodiversity, interesting possible changes to the cows diet, generally higher protein levels but more complex grazing properties. In mixed species pastures some plants are grazed out & its difficult to graze according to every plant’s requirements. However these new pastures might well enhance the health benefits of grass fed milk.
The advantages of grass fed over grain fed have been well documented in relation to possible health benefits to humans http://www.eatwild.com/healthbenefits.htm
French research on the effect of mixed pasture swards on cheese quality is interesting  http://www.ncbi.nlm.nih.gov/pubmed/21338779  
French butter has shown seasonal differences in Conjugated Linoleic Acid (CLA) levels with the highest being in summer. This suggests more pasture being fed & possible changes within the pasture composition.. http://www.sciencedirect.com/science/article/pii/S0889157504000079
Danish research comparing Danish milk with UK grass fed milk found that the UK pasture based milk had higher levels of antioxidants & lower levels of saturated fatty acids in the milk. http://www.fibl.org/fileadmin/documents/en/publications/slots-etal-feeding-strategies.pdf
Last week in Dorset with the Realfarmers Discussion Group, we viewed new Plantain plus clover pastures that were sown this spring. Its early days but it looks very impressive so far given that it’s been a very dry period of weather. These pastures were first grazed at the six leaf stage.
In Brittany, France on a recent study tour we saw a mix of new mixed sward pastures including some very productive organic Lucerne pastures that included grasses & clovers.
This farm’s pasture consumption per hectare was over 10 Tonnes DM/ha which is exceptional for an organic farm in a dry area.
There was also a range of mixed pastures that included Chicory.
These included Chicory plus Kale + grasses. This is an interesting on farm experiment. On the same farm there was Oats under sown with Chicory.
Many of these experiments are occurring on dry soils where ryegrass may not be the best option…..or rather there might be much better options.
The true value of these mixed sward pastures isn’t fully understood & there is an element of “Suck & See” trialling by innovative pasture based dairy farmers.
One thing for sure is that the “traditional view of what a dairy pasture looks like” is being severely tested. We look forward to seeing the outcomes especially as the climate warming predictions for the UK include drier summers & more variation in climatic patterns.
Current UK Pasture Measurements
Pasture growths have slowed dramatically in the drier areas of the Midlands. However in the higher rainfall areas growth rates are still excellent.
TheAverage Pasture Cover (kgsDM/ha) & Pasture Growth (kgsDM/ha/day)
Dumfries, Scotland, Average Farm Cover 2085, Growth 87kgsDM/day, Demand 37
South Ayrshire,Scotland, 2322, growth 137, will cut out supplement this week
Staffordshire, 2420, growth down to 35, feeding turnips 4kgs/day/cow, Body CS good
Shropshire Organic, 1683, gr 25, grazing very tight, still due 2 feet of rain, Dry & Dusty
Nottingham, 2150, gr68 last week but 35 this week, dem 69, feeding maize, outwintering crops good start after wholecrop
Oxfordshire, 2000, gr 40, dem 25, expecting growth to slow in dry
Gloucestershire, 2186, gr 60, dem 55, looking dry again,
Pembrokeshire, 2243, growth 77, demand 64
Devon 2345, growth 55
Devon Hills, 2446, gr92, dem 73 will be feeding turnips in 10 days
Dorset, 2440, gr 55, demand 44
Dorset, very dry, gr 20, demand 40, 40 day round, about to feed silage
Sussex organic, 1800, growth 30, dry cows on 3 groups, nearly have required silage

Friday, 24 June 2011

Stop Trashing Our UK Countryside & Our Farms

WHO IS RESPONSIBLE?????


THE RAGWORT IS TOTALLY OUT OF CONTROL IN THE UK.

TIME TO COMPLAIN....WHO IS NOT DOING THEIR JOB???

I spend hundreds of hours driving through this pleasant & green land. One can’t help but see & feel the beauty of this Agricultural (industrial) landscape that is rural Great Britain.
However over summer this beautiful landscape is ruined by the disgusting sight of “out of control” Ragwort on the Motorways, public roads, the rail network & even in the towns & cities.
It makes me feel sick inside. It seems nobody gives a damn!
Ragwort is a noxious weed. Who is responsible?????
Common Ragwort used to be rarely seen because farmers would not tolerate it. Even the Daily Telegraph reported
“The change from rarity to infestation (….of Ragwort) reflects a fundamental change in Britain: from a society with a strong rural culture and understanding to a country dominated by urban values”
Ragwort can be highly dangerous to grazing animals including cattle. Every Ragwort plant has up to 150,000 seeds which can remain viable for up to 20 years. Seeds can be blown in the wind up to 100 m.

Natural England is responsible for enforcing the Weeds Act 1959
http://www.naturalengland.org.uk/ourwork/regulation/wildlife/enforcement/injuriousweeds.aspx & the Ragwort Control Act 2003. http://archive.defra.gov.uk/wildlife-pets/wildlife/management/weeds/pdf/cop_ragwort.pdf
Why are they doing absolutely nothing about this outrage?
There is an army of bureaucrats snooping in the name of GB’s farming’s red tape, so why aren’t they waging war on those public authorities allowing ragwort to grow out of control. Ragwort is a serious threat to pasture based grazing farms.
Who's responsible for roadside weeds? The control of roadside vegetation, including common ragwort, is the responsibility of the Highways Agency in the case of motorways and other trunk roads, and the local highway authority, e.g. County Councils, in respect of all other public roads.
The Weeds Act 1959 provides for the serving of a notice on the occupier of land when ragwort is present and is deemed to be a nuisance — the offence occurs when there is a failure to comply with such a notice.
The presence of ragwort, however dense, is not a problem in itself unless it is in danger of causing a nuisance by spreading to neighbouring land. (I think this is an appalling weakness in the regulations)
The Ragwort Control Act 2003 defines an infestation as being of high risk when it is present and flowering or seeding within 50m of land used for grazing by horses and other animals or land used for feed or forage production. At 50-100m distance the infestation would be classed as of medium risk, and of low risk when at a distance greater than 100m.
I suggest you complain
Telephone: 0845 6003078 or 0114 2418920 Website:
www.naturalengland.org.uk
Telephone: 08457 50 40 30 website: www.highways.gov.uk DON’T TRASH OUR FARMS
Why in England do people regularly trash the landscape with litter? I don’t understand the mentality of the litterer! Day after day near my village (& probably your village & your farm) litter is dropped from passing cars & vans.
Do these people realise that not only do they trash my (& their) living environments but they put at risk farm animals & farmers. Dairy cows are curious creatures that will play with trash not realising that plastic can endanger their lives. Farm machinery will change a beer can into dangerous metal for farm staff & dairy cows. By walking regularly sadly you see the local area trashed daily…by whom? Well does the fact that a very high percentage of the rubbish includes: - beer & coke cans, McDonalds, cigarettes & the Sun Newspaper give us any hints??????? The countryside & the landscape is one issue but farms are OUR OFFICE, OUR WORKPLACE & OUR HOMES……STOP littering OUR FARMS.
Current UK Pasture Measurements

Pasture growth still very variable dependant on rain. Some spring like growth in Northern Ireland & the south of England. Eastern counties struggling still. However big improvement generally with pasture growth & average Farm Cover. The grass based organic farms have slow growth rates & relatively low covers. Some organic farms have NOT yet cut any silage off the grazing platform.Keep grazing rotations long as we are now entering summer with soil that is still dry for this time of year.

TheAverage Pasture Cover (kgsDM/ha) & Pasture Growth (kgsDM/ha/day)
Portaferry,Nth Ireland,AFC 2130, growth 71kgs/ha/day, after 2 weeks of rain
South Ayrshire, Scotland, 2324, gr72, soil temps 15.3 degrees


Dumfries, Scotland, AFC 2080, growth 64

North Wales, AFC 1950, gr 44, demand 55

North Wales, AFC 1970, gr 67kgs

Cheshire organic, 2100, growth 30

Shropshire organic, 1764,gr 33 (ouch) cutting lots but growth now

Shropshire, 2100, gr 65, so magic day is here again!!!!

Derbyshire, AFC 2231, growth 58, demand 61

Staffordshire, 2415, gr 64, de 49, reasonable rain last 10 days

East Staffordshire, 2160, growth 50, cutting 9% of farm today

Nottingham, growth 40, demand 60 feeding maize rain showers okay til mid July

Oxford, 2350, gr 40, 30 day round,grass Q not good, still cracks in dry soil

Gloucestershire, 2137, gr87, demand 63, 20% of platform taken out for silage

Dorset AFC 2300, growth 122

Dorset organic, 2100, growth 39, topping

Dorset, 2427, gr61, 45 day grazing rotation

Dorset, 2350, gr 75, milk, M/solids & cow condition all improving since rain

East Sussex, 2004, growth 65, grass in some order now

Devon, 2250, gr67, demand 50

Devon, 2250, growth 64

Cornwall, AFC 2100, growth 85

Flensburg, Northern Germany,organic, AFC 1890, growth 49, 32 day grazing rotation, some rain & improvement in situation


Friday, 27 May 2011

Dairyfarmers can produce a Green Dairy Industry

The Dairy Industry has the potential to produce its own electricity & be clear of the National Grid. What a PR victory that will be for the first UK dairy company & their suppliers. What a wonderful image that will be for milk, cheese & butter! Every dairy farmer must get involved to “kick this goal” for the dairy industry. We have a fantastic opportunity right now with interest free loans & massive incentives thru the Feed in Tariffs for on farm generation. Each dairy farm has the potential to generate more than they consume in the milking parlour plus the surplus could effectively be claimed by the milk processor for the good of milk (even though in reality the producer gets paid for surplus sales into the grid). Let’s look at wind! Gavin in North Devon has installed two 11Kw Gaia wind turbines – i.e. they will produce 11Kw per hour in ideal wind. http://www.gaia-wind.com/ His farm site has an average wind speed of 5.7metres per second – not very windy but he does get a little wind on most days – it is also clean wind from all directions. The Gaia turbine is designed to start at low wind speeds ( 3 m/s – most others need 5 before they start producing ) and has a fixed rotor speed making it fairly quiet – which is why he chose that type of turbine. The Turbines were predicted (at av. 5.7m/sec) to produce 32,000 Kilowatts each in the year. In 10 months the average daily production has been 90 Kw per turbine giving a predicted yield of 32,850 – as long as the wind blows for the next two months. With a production of 65,000 (current annual consumption is approx 55,000kwh)the income should be £17,000 from the Feed in Tariffs and the sale of electricity (paid for half of what I produce). With a saving of not buying 30,000 units at 8p gives a saving of £2,400. So £19,400 annual gain (the Feed in Tariffs are also index linked and guaranteed for 20 years for wind) from a £100,000 total cost gives a very healthy return on investment.Pay back period is close to 5 years & the turbines are generating 120% of farm consumption. Behind the new Microgeneration Certification Scheme (MCS) is the drive to reduce UK carbon emissions in order to bring them into line with European standards. The Government aim to eliminate all carbon emissions by 2050 and the current projection is that by 2020 almost half of the electricity used in the UK will be from low carbon sources. In order to reach these targets the Government is relying on residential & small business owners to switch to renewable energy and help eliminate the carbon footprint. At the heart of the scheme is a tariff of 26.7p/unit for all renewable electricity generated from small wind turbines in the 1.5-15kW range. This incentive replaces the carbon credit (ROC) scheme for small wind turbines. If you install a small wind turbine will now benefit from the feed in tariff in three ways: lower energy bills, payments from electricity you feed back into the grid, & further payment from the FIT for all the energy you generate & either use yourself or feed back to the grid. http://www.gaia-wind.com/
The challenge on all dairy farms is not about “can the farm generate more energy than is consumed” but rather “how to deal with the peak loadings of the twice daily milking”. There are several options- first is to store the energy generated either in batteries or in say hot water or ice. The technology for batteries is not yet efficient enough but it’s an area of intense worldwide research.
http://www.therenewableenergycentre.co.uk/ http://www.decc.gov.uk/
The obvious solution is to reduce peak demand. First you should be installing a Smart meter to monitor existing power consumption. Ask your electricity supplier
http://www.electricityprices.org.uk/free-smart-meters/
Next you need to investigate the technologies that are already being used successfully by other dairy farmers eg Varivac systems.
http://www.corkillsystems.co.nz/ Every parlour is different but generally with the oil vane type pumps that are predominant in the UK, savings are around 75% of power usage on the pumps themselves, generally the savings are around 40% over the whole parlour electricity cost. Varivac have single phase models to cover the whole range so really any parlour can have a Varivac now. http://www.rcapperdairy.co.uk/about-us.asp
Heat Recovery technology is being used successfully in many pasture based dairyfarms in the UK. Gavin in North Devon has installed Varivac & Heat Recovery units & reduced total farm demand by approx 20%. The next challenge is to install "smart technology" that allows the switching on & off of equipment when he can make full use of the wind. Tim in Shropshire has installed a heat recovery unit, solar water heating & Varivac systems. He has seen on his smart meter similar total farm saving. The Smart meter graph shows when the energy saving devices were installed.You can see the impact of the very cold weather last December when heating & hot water effectively doubled demand during milking. So it's up to you which generation option you chose but you also need to deal with reducing peak demand. See the blog I wrote on the 15th October 2010.Seek out the interest free loans


. Current UK Pasture Measurements

Mixed rainfall, most areas in the UK still dry, Wales coast good rain & growth. Cold temperatures & drying winds depressing effect of recent rain. SE England very dry & struggling for pasture.

TheAverage Pasture Cover (kgsDM/ha) & Pasture Growth (kgsDM/ha/day)

South Ayrshire, AFC 2349,Growth =Demand 68kgs, soil temp 9.9degrees C

Derbyshire, 2365, growth 80kgsDM/ha/day, Demand 64

Herefordshire, 2150, growth 55, Demand 60

Gloucestershire, 2073, growth 51, demand 50 Getting very dry

Pembrokeshire, 2041, growth 61, wedge has hole will feed silage

Sussex Organic, AFC 1481,growth 11kgs, Drying off early really need rain

East Sussex, 1900, growth 30, desparate for rain

North Devon, AFC 2350, 65kgs, some rain some recovery from dry

Limerick, Ireland, 2250, growth 70kgs

Fish Creek, Gippsland Victoria Australia (autumn) AFC 2550, growth 38, AFC increasing, unusually wet last of spring calvers being dried off.

It maybe of interest to you that this blog has been read by people in 58 different countries this month ...a truely international audience!

Saturday, 14 May 2011

"Preparer Les Terrains de L'Avenir"...Prepare the Earth for the Future

“Preparer Les Terrains de L’Avenir”. My French friends will be amazed with my command of the french language but this is a very appropriate title for this week's blog.
“Prepare the earth for the future” is the core element of a Sustainable Farming system.


My very good friends Erwan & Laurence Le Roux, who farm in Brittany, France have recently won the “Trophee de l’agriculture durable 2011” award for the most sustainable farm in France. This is a most prestigious award & I am absolutely thrilled that these innovative & forward thinking pasture based dairy farmers have won.


You can read (using Google translate) & view a video......

http://agriculture.gouv.fr/bien-vivre-en-production-laitiere
& photos of the Le Roux family & their farm this spring http://photo.agriculture.gouv.fr/galeries/TAD2011_Leroux/


The UK is somewhat behind France in encouraging “Sustainable Farming” practices & to their credit the EU Integrated Farming Initiative or EISA have thought this issue thru very well
http://www.sustainable-agriculture.org/stuff/EISA-Framework-english-040810.pdf
If you search the internet you do find other countries & organisations now working toward more sustainable farming practises, all taking a slightly different approach.
http://www.soilassociation.org/Whyorganic/Climatefriendlyfoodandfarming/Strategiesforchange/tabid/565/Default.aspx http://www.icrofs.org/ http://www.sluri.org.nz/

I think we need to interpret the EU’s EISA framework & work toward our pasture based dairy farms becoming recognised as being sustainable farm businesses using many of the benchmarking tools already developed.
The 8 main points of Sustainable Farming are:-
To have a profitable farm business not dependant on subsidies.
To manage soils for the future with less dependence on fertilizers & to build Soil Organic Matter (SOM) so increase soil carbon storage.
To reduce Energy consumption by reducing demand & generating on farm energy. To lower the Carbon Footprint of milk.
To better manage Water (conserve & reduce use), reduce pollutant losses.
To improve Dairy cow welfare, fertility & animal health.
To have a sustainable people practices.
To increase the bio diversity on the farm.
To develop long term business communication strategies not only with buyers, but with the professional support teams & the local community.
“Prepare the earth for the future” (Point 2) I think we need to rethink how we manage soils with our pasture based dairy farms. I don’t know of a single farm in the UK that has shown me a detailed soil map of the farm.
In NZ we met Shane Carroll & Nicola Shadbolt who farm in the Pohangina Valley near Palmerston North.

Shane had a very clear long term environmental plan to improve the sustainability of their farm business based on having a soil capability map. This was in our view the most forward thinking "Sustainable Farming" management practice we saw in NZ. There are many aspects of soil capability that need to be considered. However some soils are dry free draining while others are wet with poor drainage & maybe even subject to erosion. These soils should not be managed the same way especially if our goal is to increase the SOM & carbon stored within the soil.
In the UK some soils are perfect for ryegrass & white clover but others are not. Dry soils may well be better off in herbal pastures ie Chicory + clover or Plantain + White Clover without grasses. We need to move away from thinking that ryegrass/clover is our only option especially on dry soils. It may not be our best option to increase soil organic matter (SOM) either so we need to start looking outside the box.


Strawberry Clover is better suited to wet Soils


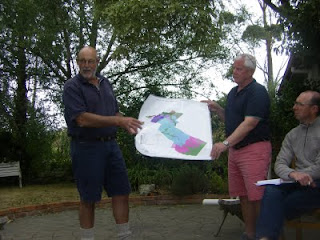
You need to start with a Farm Soil Map indicating the different soil capabilities. then develop a plan using a different approach.


Talk to me about Sustainable Farming.


Current UK Pasture Measurements


Welcome Rain in most areas 20-40mm, immediate increase in growth. However soils are still very dry & many farms have not harvested any surplus spring growth. Grazing rotations still long 30-40 days.


Average Pasture Cover (kgsDM/ha) & Pasture Growth (kgsDM/ha/day)


South Ayrshire AFC 2155, growth 62, demand 56kgs/ha/day


Dumfries, 2194, 66 growth, demand 57, cutting silage bales


Shropshire, 2300, 60 some rain this week


East Staffordshire, 1970, 39 approx 20mm rain now some growth 60-70


Hereford organic, 2114, 48, rain 46mm growth up 10kgs/day since rain


Hereford 2100, 70 growth, demand 65


Gloucestershire, 2160, 62, 22mm rain on Saturday


Gloucestershire, 2180, 85 growth

West Somerset, 2100, 50, 33mm rain but drying out again


Cornwall, 2300, 105, 32mm rain, record production STD,AI 80% in 1st 17days


Cornwall, 2398, 118


South Kilkenny, Ireland, 2075, growth 71, demand 66


Members of Wyegraze Discussion Group are all linked into Agrinet to very effectively share pasture information.....Every group should be doing this as it will help all groups https://www.agrinet.ie/Default.aspx

Friday, 6 May 2011

"The Foundation & Future of Every Farm is the Education of it's Youth" borrowed from Diogenes

We need to actively involve young people in our exciting industry. Young people with bright minds wont buy into our pasture based dairy farming system if we dont invite them to participate & to contribute. We need bright young people on our farms.
I also believe passionately that our top farmers have a huge wealth of experience to offer young people.
These top farmers have often been to university themselves so they understand whats required by students doing dissertations.
You just need to put these people together to create "the magic" & creative thinking goes wild, to everyones advantage.
Over the past 6 months
Harper Adams University, BSc (Honours) Degree in
Agriculture, Land and Farm Management student Lucy Williams has worked with
3 Pasture to Profit dairy farmers....Tom Malleson, John Millington & Rupert Major, on a project to see how Body Condition Score (BCS) affected dairy cow fertility in spring block calving herds. We used the NZ dairy cow condition scoring system where 1 BCS is equal to approx 35 kgs LWT. The target BCS at calving is 5.0. A cow that has a BCS of BCS 3 is considered to be very thin & below target.

The data indicated an important relationship between the BCS at calving & the BCS at Planned Start of Mating (PSM). The better the BCS at calving the better the BCS at PSM. This confirms the NZ studies by John Roche et al www.dairynz.co.nz & the Irish studies by Frank Buckley http://www.teagasc.ie/publications/2001/ndc/ndc-buckley.asp

In this on farm study the cows lost a little over the 1 BCS post calving then regained condition (not quite calving condition) by PSM.


There were 847 cows data from the 4 farms included in the study. 80% of these cows calved in the first 6 week block indicating exceptional dairy cow fertility(heifers were not included in these figures).


In fact these cows had a 368 day calving interval (compared to the UK average of approx 425 days). Only 9% of the cows monitored were sold empty.

All 4 herds had a conception rate to first AI service of over 60% & the average number of AI services for a pregnancy was 1.5. Again this is exceptional.

Lucy talking to John & Herdsman Simon in Staffordshire.

Cows calving in the first 6 weeks & cows calving in the second 6 weeks were all very similar in the BCS at calving (average approx BCS 4.8) & the BCS 6 weeks post calving, approx BCS 3.65. So the loss of condition post calving was also very similar. There were interesting differences however between the two 6 week groups as to the average number of days from calving to conception. The cows in the first 6 week calving block took on average 79 days to conception whereas the cows in the second 6 week block took 108 days. This is effectively an extra cycle. This is interesting but we are unsure of the reasons. The cows calving in the first 6 weeks are a reflection of the success of the first 2 cycles of AI whereas the second 6 week block is likely to be partly related to the onfarm management of bulls.

"The study has reinforced the important fact that BCS at calving is the most influential factor on BCS loss between calving and pre mating (PSM)." Said Lucy in her summary.

It was brilliant to have Lucy as part of our team & she is to be congratulated on doing a great job of pulling the data from over 800 cows together as part of her study requirements. Lucy is one of 4 students who have been working with the P2P network this year from Harper Adams. (Kate looked at Lameness, Rob examined sharefarming & Ben did a survey about outwintering....well done guys) I would also like to thank Dr Liam Sinclair from Harper Adams University for his assistance & cooperation. It has been a pleasure to involve the University with our pasture based dairy farmers.

To the many international researchers from NZ, Australia, Ireland & USA your inputs & advice has been extremely helpful.

We look forward to John Alawneh's PhD study results from Massey University, NZ. John has used Walk Over Cattle Scales (along with BCS) in a similar trial.


To obtain research funding for pasture based dairying in the UK seems near impossible. However with persistence, hard work & the willingness of top farmers to "get involved" on farm research can be achieved & we can learn a great deal from our efforts. I would like to thank the P2P farmers & their On farm teams who have freely given of their time & expertise to make this project happen.

There has been many insights gained from this BCS monitoring project over the past 2 years.....only some have been mentioned here. A very useful decision making spreadsheet (especially related to Drying off decisions & timing) has been developed by Tom, John & Rupert as well.


If you are interested contact me.

The NZ Large Herds Conference for years has had a "Young Scientist Communication Award"....we need to take the next step in that direction too.

Current UK Pasture Measurements
Still no rain over most of the UK. Pasture covers have decreased & much silage ground has been grazed instead. Demand generally greater than growth this week. General increase in concs to lengthen grazing rotations. Some rain in the lucky areas!

Average Pasture Cover (kgsDM/ha) & Pasture Growth (kgsDM/ha/day)

South Ayrshire Scotland, AFC 2157, growth 57

Nth Ireland, 1900, 30 Brown patches in fields, silage crop V poor

Cumbria, 1995, 68 need rain

Cumbria, 2330, 50 need rain

Cheshire organic 2100, 40 dry not cut silage as insurance

Nth Wales, 2000, 48 Demand 56 V dry, feeding PK to slow round

Nth Wales, 2020, 63 good rains over past 2 days, grazing conditions fantastic!

Derbyshire, 2218, growth 48 demand 59, No rain for a month, 16.5mm over past 10wks.

Shropshire, 2650, 64 Demand 68 raining now!!

Shropshire, 2280, 45 demand 47, increasing concs to 5kgs

Shropshire, 2283, 58 demand 54, bit dry

Staffordshire, 2160, 39 very dry

Staffordshire, 2400, 34 feeding higher than plating

Staffordshire, 2000, growth = demand 46, rotation 30 days

Herefordshire, 2100, 48 AFC decreasing, 5mm rain

Herefordshire org, 1964, 35 down from 54, lower covers stressed

Pembrokeshire, 2053, 48 last week 79

Pembrokeshire, 2130, 53 demand 70, "drought" got scarey but rain yesterday

West Somerset, 1950, 35 grazing silage ground increased concs

Dorset, 2358, 54 urine patches very obvious now

Dorset, 2145, growth 48, made 18ha silage hoping for rain

East Sussex, 2115, 51 No rain, cows on OAD milking yesterday

Devon, 2250, 46

I didnt ask Cornwall too depressing! Thanks guys!

Tuesday, 26 April 2011

"In Charge of the Impossible" that's a cow man's lot.

As we surveyed the new "Pasture Grazing Wedge" after the farm walk this week, the Herdsman said "In Charge of the Impossible....thats a cow man's lot"


It seems to sum up the current difficult seasonal conditions in most areas of the UK.

Faced with the unusual most people need to share ideas & an onfarm discussion is a really good idea right now!

If you need help ask....phone me!

A check of the long range forecasts confirm this frustration on the farm.


It's important to slow the grazing rotation when the pasture growth slows. Most pasture grazing wedges are very flat or they have a gaping hole indicating a shortfall. It's the short grass post grazing that has slowed down the most.

Act immediately...you are lucky your pasture measurements have given you at least 10 days notice of changes...this is when pasture monitoring pays huge dividends.

The risk is that the average pasture cover will fall & you lose control of your wedge. You may need to graze silage crops!

Check for 3 leaves before grazing it only takes a minute each day. Write down your management decisions.
Pastures are showing early signs of moisture stress. Even if N has been applied there is not a uniform response over the whole paddock. Urine patches are very clearly visible....high nitrogen application plus a large bucket of water = lush green growth. Insufficient rain leaves most of the grass struggling after grazing = pale green low growth some plant stress.
This is exceptional spring weather on top of a very dry past 12 months over most of the UK. On most farms there will be a spectacular response when it rains but this might be short lived as sub soil moisture is very low.....plan on it being a dry summer & take risk management decisions now....otherwise it could be a very expensive year.

Most herds report that cows are cycling normally. Milk solids YTD is up on most farms so the unusually weather has not yet affected milk production.The soils are cracking on many farms....never a good sign... often poor soil structure but currently due to the exceptional dry period with above average temperatures.

Cows appear to be in very good condition on most farms but most herds have 10% at the tail end.....Check the Body Condition Scores.....most group members have put these thinner cows on OAD milking. They often cycle within a week on OAD. "Vets seem to be very good at getting cows to cycle but not so good at getting them in calf" a comment from this weeks group meeting.

This is NOT the time to underfeed cows premating.

I understand the quote this week from a Herdsman " In Charge of the Impossible" neither he nor I can make it rain.

Current UK Pasture Measurements

No rain over most of the UK plus above average temperatures has decreased pasture growth on many pasture based dairy farms this week. Some farms are going back into silage crops & virtually all farms are being forced to lengthen the grazing rotations some out as far as 40 days to maintain the grazing wedge.

Many farms reporting that it is the recently grazed pasture that is under the most moisture stress & growth rates have slowed to about 20kgs/ha/day on those paddocks.

Average Pasture Cover (kgsDM/ha) & Pasture Growth (kgsDM/ha/day)

Cumbria 2150, growth 80kgs, covers well up on last week

Nth Wales 2052, 67 some showers this week

Staffordshire 2040, 41 (demand 54) very dry

Staffordshire 2067, 49

East Staffordshire 1800 (2250 whole farm), 31 growth, will cut 3 for silage, 40 day

Derbyshire growth 62 same cover

Nottingham 2100, 80, demand = 70 Very dry

Shropshire 2157,38 (growth dropped), demand = 44

Oxfordshire 2090, 70 surprised at growth as very dry

Herefordshire organic, 2123, 49

Gloucestershire, growth dropped 20 to 78, covers down slightly

Gloucestershire, 2000, 70 compared to 77 last week, Very dry

Dorset, covers same, growth 70, pregrazing 3400 residuals 1600

East Sussex, 2002, 56

Devon, 2500, 70, 20% of farm shut for silage

Cornwall, 2400, 90

North Germany, growth slow, very dry no rain, staying on OAD milking

Brittany, France, Very dry & warm


Friday, 1 April 2011

Better Communication = Better InCalf Rates

I've just seen a simple idea to improve communication between staff on a pasture based spring calving dairyfarm in Dorset, UK. This came to light at the "Realfarmer" discussion group.....a group for Herdsmen & Herd Managers/farm staff on pasture based dairy farms. "Tail Tape Id".... yes that's right "Tail Tape Id!" "Tail Tape Id" is hardly a new idea....often used to identify cows with mastitis or different calving batches pre drying off in many pasture based herds.


However Gary & Will in Dorset are now using it to identify non cycling cows in the herd in the pre-mating month before AI starts.

Every cow has an orange tape wrapped around it's tail(this week one month pre AI). If there have already been Vet treatments a different colour is applied too.

If any staff member thinks the cow should be rechecked (for whatever reason) she gets another tail tape.

Once the cow has been seen in heat the Tail Tapes are removed.

Gary & Will have a very good track record with a very compact calving block.


It's a team effort & it's important every one in the team is up to speed.....with every cow, every day.....even though there are more than 300 cows in the herd. It can be done but you have to be smart!

It also concerns me that it's hard to observe the correct 'Cow Number' on many farms. The freeze branding on many cows & on many farms is very poor. How do you pick the right cow if the Cow Number is impossible to read?????

At the very least the numbers need to be clipped now. However I think alot of freeze branding needs to seriously improve!!


Below you will see three cows with the "Tail Tape Id".....the cow on the left has already been identified as requiring another vet check (what is her number??? not easy to read is it!). The 2 heifers have very clear easy to read numbers.

Identifying non cycling cows is seriously important in a block calving system & it needs to be done early. The evidence is that the earlier problem cows are identified the better & the more likely that they will remain in the 8-10 week calving block. "Cows with a history" are already known that is cows that had problems at or about calving....twins, milk fever, difficult calvings etc.
Heifer rearing is part of this story too. Dr John Moran (Victoria Australia) said increasing liveweight at first calving would improve milk production and fertility.

http://www.weeklytimesnow.com.au/article/2011/03/28/309881_dairy.html It would also reduce the age at first calving and dystocia. Dystocia can increase the time to conception by 14 days and reduce the first lactation milk yield by 650 litres.

The quicker problem cows are identified & treated by a Vet the better.


Cow Body Condition Score (BCS)both at calving & pre mating are very important. You need to minimise the Condition Score loss post calving. Early work by Dr.Jock MacMillan in NZ (with Discussion Group farmers) in the early 1980s clearly linked BCS to fertility. So too did work shortly after at Ellinbank in Victoria, Australia.

It will take 8 days longer for a cow at a BCS of 4( NZ Scoring system) to cycle compared to a cow at a BCS of 5.

Pregnancy rate at 1st insemination for cows with a BCS of 5 will be 1-2% higher than those calving at a BCS of 4.

Empty rates are generally greater in cows that are thin in early lactation (2% for each BCS unit) data from DairyNZ .
However, as herds get bigger it's rapidly becoming a staff management issue as to whether cows get in calf or not, within the targetted block. Do staff fully understand the game plan & their role. Can everyone including relief staff pick cows in heat? Now that the peak calving period is over....the first issue is to offer tired & fatigued staff time off to fully be at their best pre-mating & AI.
Maybe using "Tail Tape Id" might help your pre-mating management & communication between staff.

BETTER COMUNICATION = BETTER INCALF RATES.

Current Pasture Measurements from around the UK
Grazing conditions have been excellent during March but pasture regrowth rates are poor due to very dry conditions. Some areas have just had good rain & should expect rapid growth...but the country remains very dry overall.
Average Pasture Cover(kgsDM/ha) & Pasture Growth rates (kgsDM/ha/day)
Dumfries, 1850kgsDM/hectare & 30kgsDM/ha/day

Cumbria, 1600 & 18....(Top of wedge 2100 feeding like 2400)

Shropshire, 1650 & 30


Shropshire 1950 & 20 (demand 35)

Derbyshire, 1865 & 35

Nottingham, 1850 & 25.....no rain all of March....very dry!

Gloucestershire, 1900 & 41

Gloucestershire, 2028 & 60 (Spring is here!!)

Somerset Organic, 2115 & 35

Sussex, 1750 & 25

Dorset, 1816 & 15

Devon, 2100 & 43


Cornwall, 2450 (1900), 58 growth ....have pulled out surplus to reduce cover to 1900. Just had another 30ml rain.

Sunday, 16 January 2011

Chicory & Plantain Downunder in NZ


I'm in very dry New Zealand awaiting the arrival of my French Discussion group from Brittany.(very impressed with the exciting range of milk products in the supermarkets..much bigger range than when I last visited NZ).

NZ has had very little rain (unlike the poor farming souls in Queensland Australia who are getting floods that are up to 15metres high!!) so since November the dairy farms have struggled for grass.This photo is of Neil & Barbara McLeans farm just north of Hamilton in the Waikato..the cows are getting some pasture plus Barkant turnips.

In preparation for the french visit to NZ I have visited DairyNZ at Hamilton & with Chris Glassey had a really good look at parts of Scott Farm.Here are plots of Chicory & Plantain being harvested.

One of the trials at Scott Farm is looking at Chicory & Plantain (both deep rooting herbs) as alternate pasture species. NZ farmer experience suggests that chicory is really good in year one but declines in year 2. Work at Massey (Prof Peter Kemp) & at DairyNZ with Julie Lee is looking at how pre grazing heights and post grazing residues are affecting Yr 2 survival.
This is interesting work which could be implemented by farmers very quickly. As we are seeing a number of NZ farmers on this study tour plus Lincoln & Cropmark in Canterbury I think we will learn much more about these two intriguing plants.
Chris Glassey from DairyNZ explained that Plantain plus Clover was very competitive with ryegrass plus clover even at a stocking rate of 3.5 cows per hectare.Here is a photo of Plantain during a very dry summer in the Waikato. It's interesting isn't it....when I first started work as a consultant both Chicory & Plantain were considered weeds.....now they both look very good pasture herb options for the future.

Friday, 10 September 2010

The Origins of the Pasture Wedge Graph

Have you ever wondered how the

"Pasture Wedge Graph" started. 

Who invented it & who developed the original concept?


Tom Phillips (thats me!) developed the original concept of the Pasture Wedge Graph.
 I was working with Discussion Group dairyfarmers in the Matamata area of the Waikato, New Zealand in 1976. Initially it started as chalk drawn wedge diagrams on milking shed (milking parlour) walls or concrete floors.... that resembled silage clamps of pasture stored on the farm that day. This was before white boards or computers remember....we had it tough in those "oldie" days.
The development of the Pasture Wedge Graph is a classic example of a product of an ideas person/adviser working with smart farmers & combining forces with very good researchers & communicators....classic "Tipping Point"as the Pasture wedge Graph is now used in every pasture based dairy industry through out the world.
http://en.wikipedia.org/wiki/The_Tipping_Point

This photo is of the very first "Pasture Wedge Graph".....a photo that very proudly hangs in my office.

The very first official "Pasture Wedge Graph" was drawn by me (1976) to represent the "ideal pasture for grazing "......fast growing lush pasture of about 15cm (6 inches) at the top of the diagram & at the bottom of the wedge we showed the short residual (stubble) that was 3cm long. At the extreme ends was grass that was too long for grazing (note the stalky tall grass with little clover & dead matter at the base OR pasture that was too short.....both affecting milk yields (cow pasture intakes) & opening up the sward & encouraging weed infestation.
The next "small but very important"step was taken by me working closely with two now famous NZ Researchers at Ruakura.....Des Clayton & Dr Arnold Bryant. Arnold was a friend of mine & at the time was one of NZ's best known dairy researchers heading the team at No2. Dairy Ruakura. The concept of the wedge appealed to Arnold as it neatly summarised the work at No.2 Dairy. This was quite an achievement as Arnold was a tough man & a very rigourous scientist. Des then took the idea of the wedge across NZ in his role as advocate for research at Ruakura....the rest is history as they say.....
Dr Arnold Bryant had a massive impact on NZ Dairy farmers & the way in which grazing management was so important to low cost productivity. You may not have heard of Dr Bryant but believe me he influenced a generation of farmers & advisers. Quite rightly he has been honoured for his contributions to grass based dairy farming world wide.
http://www.voxy.co.nz/business/agriculture-recognised-honours-list/5/51243.
After working in NZ I moved to Victoria Australia......where we used the pasture grazing wedge extensively in the DPI Dairy Officers' extension program & later the Target 10 program in the mid 1980s.
Australian dairy farmers really contributed to the thinking as they faced abrupt changes to pasture growth patterns. So how to move from one grazing rotation to a different grazing pattern was really tested in Victoria. Its a very good example of collaboration and participatory research & development. Now there are so many packages and cloud based products available to farmers in many different countries.......sadly few realize nor acknowledge the participatory process that key farmers contributed to......... to even get the thinking right back in the 1970-80s.
Victorian dairy farmers played an important role to the development of the Pasture Wedge Graph concept.
Thanks guys!
Much much later in the early 2000's work at Lincoln University Dairy Farm revisited Arnold Bryant's work. Adrian Van Bysterveldt & Peter Gaul started to put numbers on the pasture wedge graph & ask the question how could they record plate meter readings and use it as a predictive tool. They had a very special WOW moment.....the rest is history!

The very first scientific paper documenting this mathematical assessment of the pasture wedge graph was written by Adrian at the SIDE Conference 2005 "Lincoln University dairy farm, now a cropping farm?" Proceedings of the New Zealand South Island Dairy Event. LUDF and Adrian & Peter in particular  very successfully used the demo farm to extend the grazing message.....this time world wide as the internet website has been so successful. http://www.siddc.org.nz/.

Actual figures & an understanding of the mathematics of the Demand line gave this humble graph immense power.
The real power lies in the fact that it is VERY SIMPLE but conveys a powerful message in the visual picture.
When I first arrived in the UK in 2001 I was amused but very proud to hear terms like "Pasture Wedge Graphs" & "Magic Spring Day" which I had developed back in 1976. It's intriguing that that language of the grass based dairy farmer has traversed through out the world & is being used not only correctly but very successfully by advisers & farmers.
It's not only the UK of course but the grazing wedge has got to the USA as well as Ireland, Argentina & Chile & South Africa & France.
.http://plantsci.missouri.edu/grazingwedge/.

Now we are moving rapidly into a new & exciting phase....online data bases where individual grass based dairy farmers anywhere in the world can log their pasture measurements, look at their pasture wedge graphs & compare with other groups of farmers & their consultants.
This could have a big influence on how Dairyfarm Discussion Groups use & compare grazing data.
Can I introduce Agrinet.....https://www.agrinet.ie/Default.aspx
The Agrinet website will allow grass based dairyfarmers who regularly measure grass with a platemeter to go online & calculate their data & wedge graphs online. The real power will be the ability to team up with your fellow Discussion Group members & compare graphs. Keep your grazing consultant in the loop too.

I strongly recommend you have a look at the Agrinet website......its free until 2011 when the annual fee is expected to be approx 80 Euros per year. Try it & talk to your group about joining .....lets talk about it on the Pasture to Profit Network Discussion Group on Facebook.

I'm incredibly proud of this humble little Pasture Wedge Graph that started life before many current users were even born. It's had a huge impact on grass based dairy farm management for thousands of farmers all over the world.....it's come a long way from Jim Diprose's concrete cow yard chalk diagram at Matamata.

I guess we've reached the "tipping point"!
Can I make the plea with current & future users to "Keep it Simple" as the real power is in it's simplicity!

In the UK we are now entering a critical stage of the grazing cycle. We are currently grazing the second to last time & we need to build covers to approx 2600-2700 by or for the first week of October.

Regular measurement & use of the grazing graphs is critical. This is a time of critical decisions & you have to get the timing just right. You must know the target covers for October. You must graze grass out cleanly & get the residuals down to 3cm or 1500kgs DM/ha.

A current dilemma on many Discussion Group farms (especially those that have only had recent rains) is the patches (Grass Monuments) of high nutrient grass that the cows are very reluctant to graze. Under each of these "Grass Monuments" that are embarrassingly obvious (due to colour & height) at the moment is an old dung pad. Grass Monuments are normally associated with under grazing or low stocking rates but in this case its a seasonal issue after rains that broke an unusual dry spell. The issue is do you pre mow & graze these paddocks or do you get it in the first week of October when you start your last grazing rotation.


Some Autumn Calvers have stored pasture since June which they are now grazing with the Springers mob. Below is a photo of an Autumn calving group on a mixed sward of deep rooting species including Chicory. This is an interesting concept that along with the "tall Grazing concept" is designed to increase the Soil Organic Matter....interesting onfarm experimental work by innovative farmers.
Remember the target now is to build pasture covers to approx 2600-2700kgs DM/ha by the first week of October. The last grazing rotation will start on most UK grass based dairyfarms in the first week of October & end sometime in November or December depending on wetness & when grass covers reduce to about av. 2100kgs DM/ha.
Grass Covers & Pasture Growth This Week
Northern Ireland 2350kg Av Cover, 70kg DM/ha growth, Demand 45kgs/ha
Dumfries 2550, 55kg growth, 51day rotation
Cumbria 2600, 54kg growth
North Wales 2050kg, 43kg
Cheshire Organic, 2223, 43kg
Shropshire 2470kg, 89kg
Staffordshire 2396, 51kg
Staffordshire 2610, 45kgs rain needed
Hereford Org 2329, 41kg
Hereford Org 2520, 45kgs
Hereford 2300, 50 kgs, 35kg demand, 3kg cake
Gloucestershire 2522kg, 77 kg growth, 30 days
SW Wales 2537, 85kg growth, 37 demand, 32days
SW Wales org 2664kg cover
SW Wales 2350kg, 65kg growth
Somerset Org 2350, 50kg growth
Dorset 2289, 40kg growth, 45 days
Dorset 2250, 47kg growth
Cornwall 2500, 80 kg growth
Cornwall 2250, 40kg, 36 days
Limerick Ireland 2400, 65kg
Rotorua NZ 2040kg cover & 52 kg growth